Make Data-driven Decisions event analytics software
Utilize our Event Analytics Software to understand your audience, their purchasing patterns, interests, and other attributes, vital for retaining attendees and improving results in future events.
No Obligation Discovery Call

Drill Down the Reports
Attendance and Demographics
Gain insights with our Audience Report Software. Access attendee profile data like age, gender, and location, essential for Event Management Analytics. Export this data for email marketing and surveys, improving your event kpi strategies.
Tickets Sales & Revenue
Our Event Analytics Tools offer detailed sales trends and transaction overviews. Skip the excel and visualize data with graphs and charts, a feature enhancing your Event Tracking Software capabilities.
User Activities & Engagement
Analyze each user interaction with our Event Analytics Platform, from login to logout. Examine session durations, booth visits, and poll answers, integral for Event Data Analytics.

Get Crucial Marketplace Insights into your Event's Performance
Order Tracking
Track orders and total revenue generated, a key component of Event Monitoring.
Product Performance
Our platform provides comprehensive insights into product performance, crucial for measuring ROI for events.

Maximize your Prospects
Leverage Event Tracking Software to increase attendance and identify new revenue streams. Use Event Analytics Software for effective CRM solutions and real-time data tracking.
Effective CRM solutions to manage all time data
An overview of KPIs and metrics of all the executed and upcoming campaigns
Email Marketing Campaigns to stay connected with your visitors
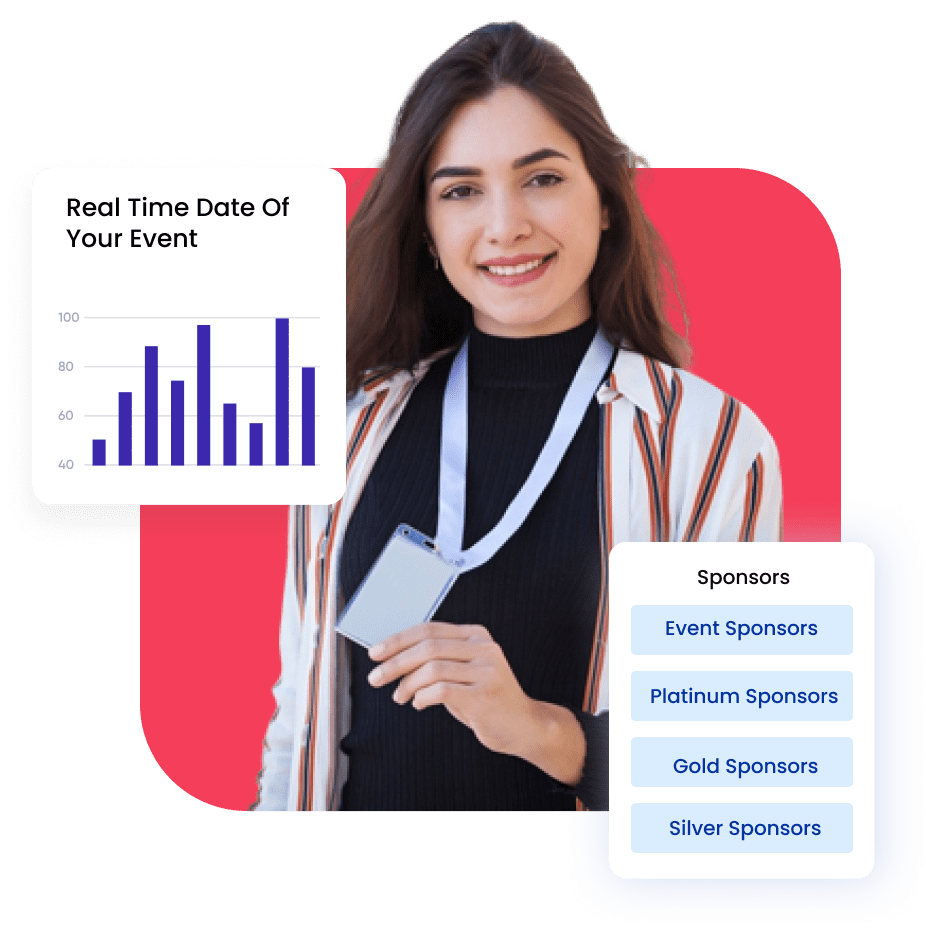
Track Real-time Data
Full Visibility Of Individual Sessions
A real-time data tracking system that provides full visibility into individual sessions, allowing you to monitor ttendance, engagement, and other key metrics in real-time. this information can be used to make data-driven decisions, optimize the event schedule, and identify areas for improvement.
Access For Sponsors And Exhibitors
Share real-time audience insights with event partners, a feature supported by the best event analytics software, helping tailor their messaging and offerings.

Enhancing Events with Session & Speaker Ratings
Use our platform’s rating system to improve event quality and speaker presentations. This feedback is crucial for Event Tracking Google Analytics and measuring the ROI of an event.
Ready to Unlock Powerful Event Analytics?
Transform your event data into actionable insights with our comprehensive analytics software. Track attendance, monitor engagement, analyze revenue, and make data-driven decisions to maximize your event's success — all in one powerful platform.